Good Explanation of Climate Change and Why is it so Cold this Winter?

Regarding the question, why are our winters so cold? As stated in the video, we will continue to get cold weather, but the locations receiving the coldest weather may move due to climate change. For example, here’s todays weather in Buffalo, NY and North Pole, AK:
Buffalo: 5 degrees Fahrenheit
North Pole: 21 degrees Fahrenheit

The following figure illustrates the weird distribution of temperature in the Northern Hemisphere.
Climate-Changed

Cool Google Map Area Calculator App

Online area calculator tool for Google maps.  In the example below, the area of Puerto Rico is calculated to be 8,939 km^2.  The official area is closer to 9,100 km^2.  I created the map below quickly (in about 1-minute), but I could probably obtain a more accurate estimate of area if I took a bit more time.  This tool could be valuable for estimating the area of farm fields, catchment areas for estimating surface runoff, etc.

googlemapareacalculator

http://www.mapdevelopers.com/area_finder.php


UPRM Graduate Level Course: SPECIAL TOPIC IN AGRONOMY Satellite Remote Sensing: Applications in Agriculture Water Management in Puerto Rico

UPRM Graduate Level Course:
SPECIAL TOPIC IN AGRONOMY
Satellite Remote Sensing: Applications in Agriculture Water Management in Puerto Rico

COURSE ANNOUNCEMENT - ERIC HARMSEN - 2ND SEMESTER 2014-2015

Pope Francis’ edict on climate change will anger deniers and US churches

Pope Francis: “An economic system centred on the god of money needs to plunder nature to sustain the frenetic rhythm of consumption that is inherent to it.
“The system continues unchanged, since what dominates are the dynamics of an economy and a finance that are lacking in ethics. It is no longer man who commands, but money. Cash commands.
“The monopolising of lands, deforestation, the appropriation of water, inadequate agro-toxics are some of the evils that tear man from the land of his birth. Climate change, the loss of biodiversity and deforestation are already showing their devastating effects in the great cataclysms we witness,…”

http://www.msn.com/en-us/news/world/pope-francis-edict-on-climate-change-will-anger-deniers-and-us-churches/ar-BBhh997?ocid=mailsignoutmd

Climate Change 101 for Corrupt Politicians

Downscaled Climate Data Projections for Puerto Rico Now Available

The Caribbean Landscape Conservation Cooperative (CLCC) has just announced the release of downscaled climate data projections (through 2099) for Puerto Rico.  This is a valuable resource, which will allow scientists from many fields to evaluate climate change impacts in their respective fields.

The data have the following characteristics:

Projections of daily maximum and minimum temperature and twenty-four hour cumulative precipitation for over 200 long-term weather stations throughout the region for the period 1960-2099 based on Global Climate Models (GCMs) from the Third Coupled Model Intercomparison Project (CMIP3) used for the Fourth Assessment Report of the Intergovernmental Panel on Climate Change (AR4 IPCC).

Projection datasets are available for three greenhouse gas emission scenarios: high (A2), medium (A1B), and low (B1). The global model output for precipitation and temperature were downscaled to local station locations by Hayhoe (2013): 71 stations for precipitation, 29 stations for maximum temperatures (Tmax) and 27 stations for minimum temperatures (Tmin).

Download the downscaled precipitation and temperature data here.  (After loading website, click on Geospatial Data.)

PRAGWATER now providing daily reference evapotranspiration for St. John, USVI

Daily reference evapotranspiration (ETo) is now available for St. John (USVI) at the following link: Northern Caribbean ETo .  The link also includes ETo data for St. Thomas, St. Croix, Puerto Rico, Hispaniola and Jamaica.

Yesterday’s Reference Evapotranspiration (ETo) for St. John, USVI


The following links will provide guidance on scheduling irrigation using the ETo map data.

Harmsen E.W., 2012.  TECHNICAL NOTE: A Simple Web-Based Method for Scheduling Irrigation in Puerto Rico.  J. Agric. Univ. P.R. 96 (3-4) 2012.

A simple irrigation scheduling tool for using ETo maps

Challenges of doing research on the UPRM Campus

Recently I initiated a calibration study of two Campbell Scientific weather stations on the University of Puerto Rico-Mayaguez Campus. Calibration of the two stations equipped with older sensors, is being accomplished with a third station with new sensors.

Two weeks ago I took the following photographs which illustrate how the maintenance crew of the university aggressively trim the grass around any and every standing thing, including my research equipment. Their practice is to trim the grass down to the bear soil, and over time cut into the soil itself, thus creating a depression around the trees, telephone poles, sidewalks, etc.  Why do the workers do this?  I guess the reason is because it makes the area look cleaner and also gives them more time before they have to return to trim again.  The down side of this practice is that the soil is exposed to the intense rainfalls, common in Mayaguez, which may lead to soil erosion.

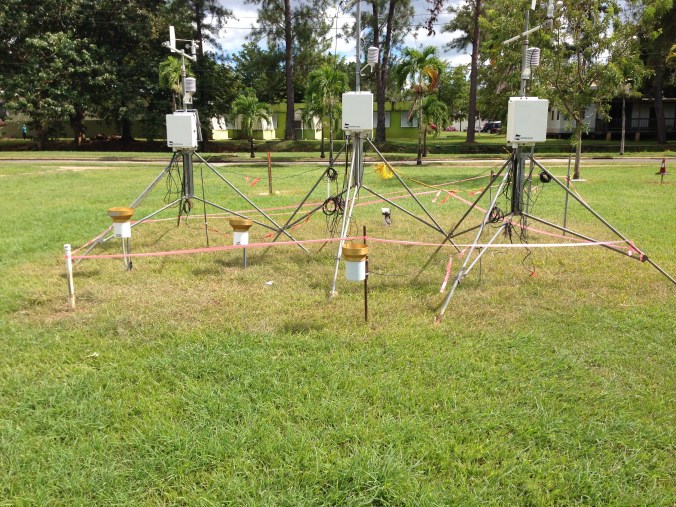
Here are two photos showing excessive trimming around my research equipment. The sensors are sensitive to the ground cover, especially the net radiation sensor.  Consequently the alteration of the site by trimming may compromise the integrity of the data collected by the instruments.  The preferred situation is green grass that is 3 or 4 inches tall.

IMG_5648Figure 1. Excessive trimming around the research equipment.  To prevent further trimming within the area, the red construction tape was put up around the perimeter.


IMG_5651
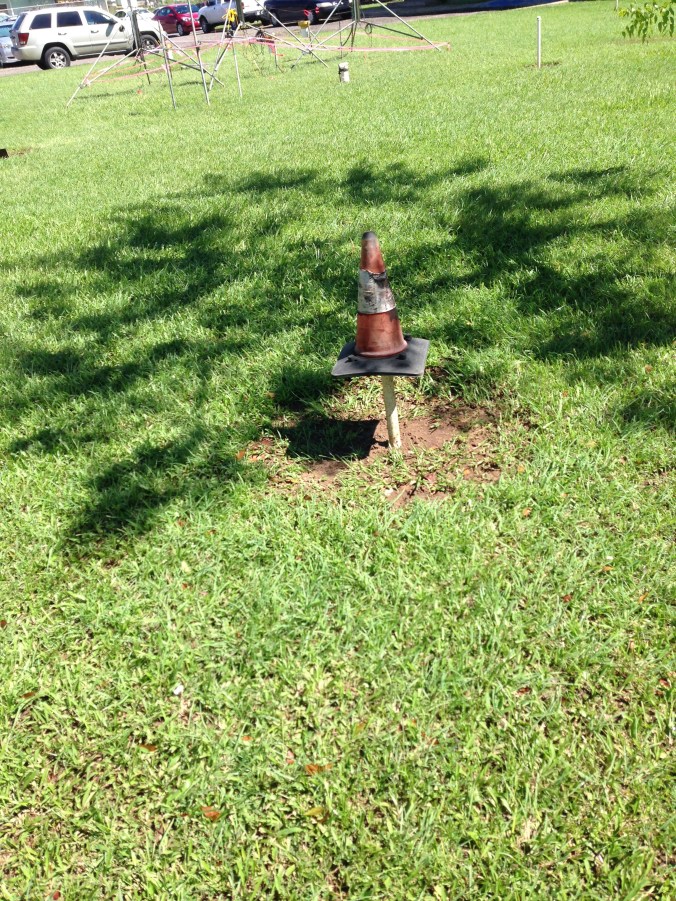
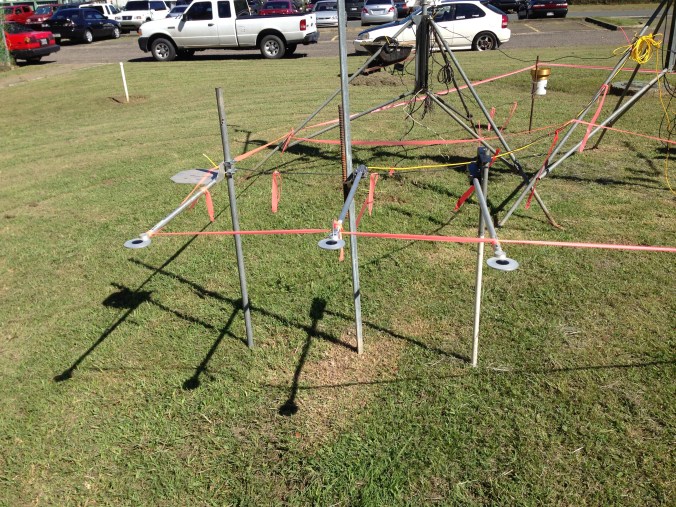
Figure 2. Excessive trimming of grass is observable under the center net radiation sensor.


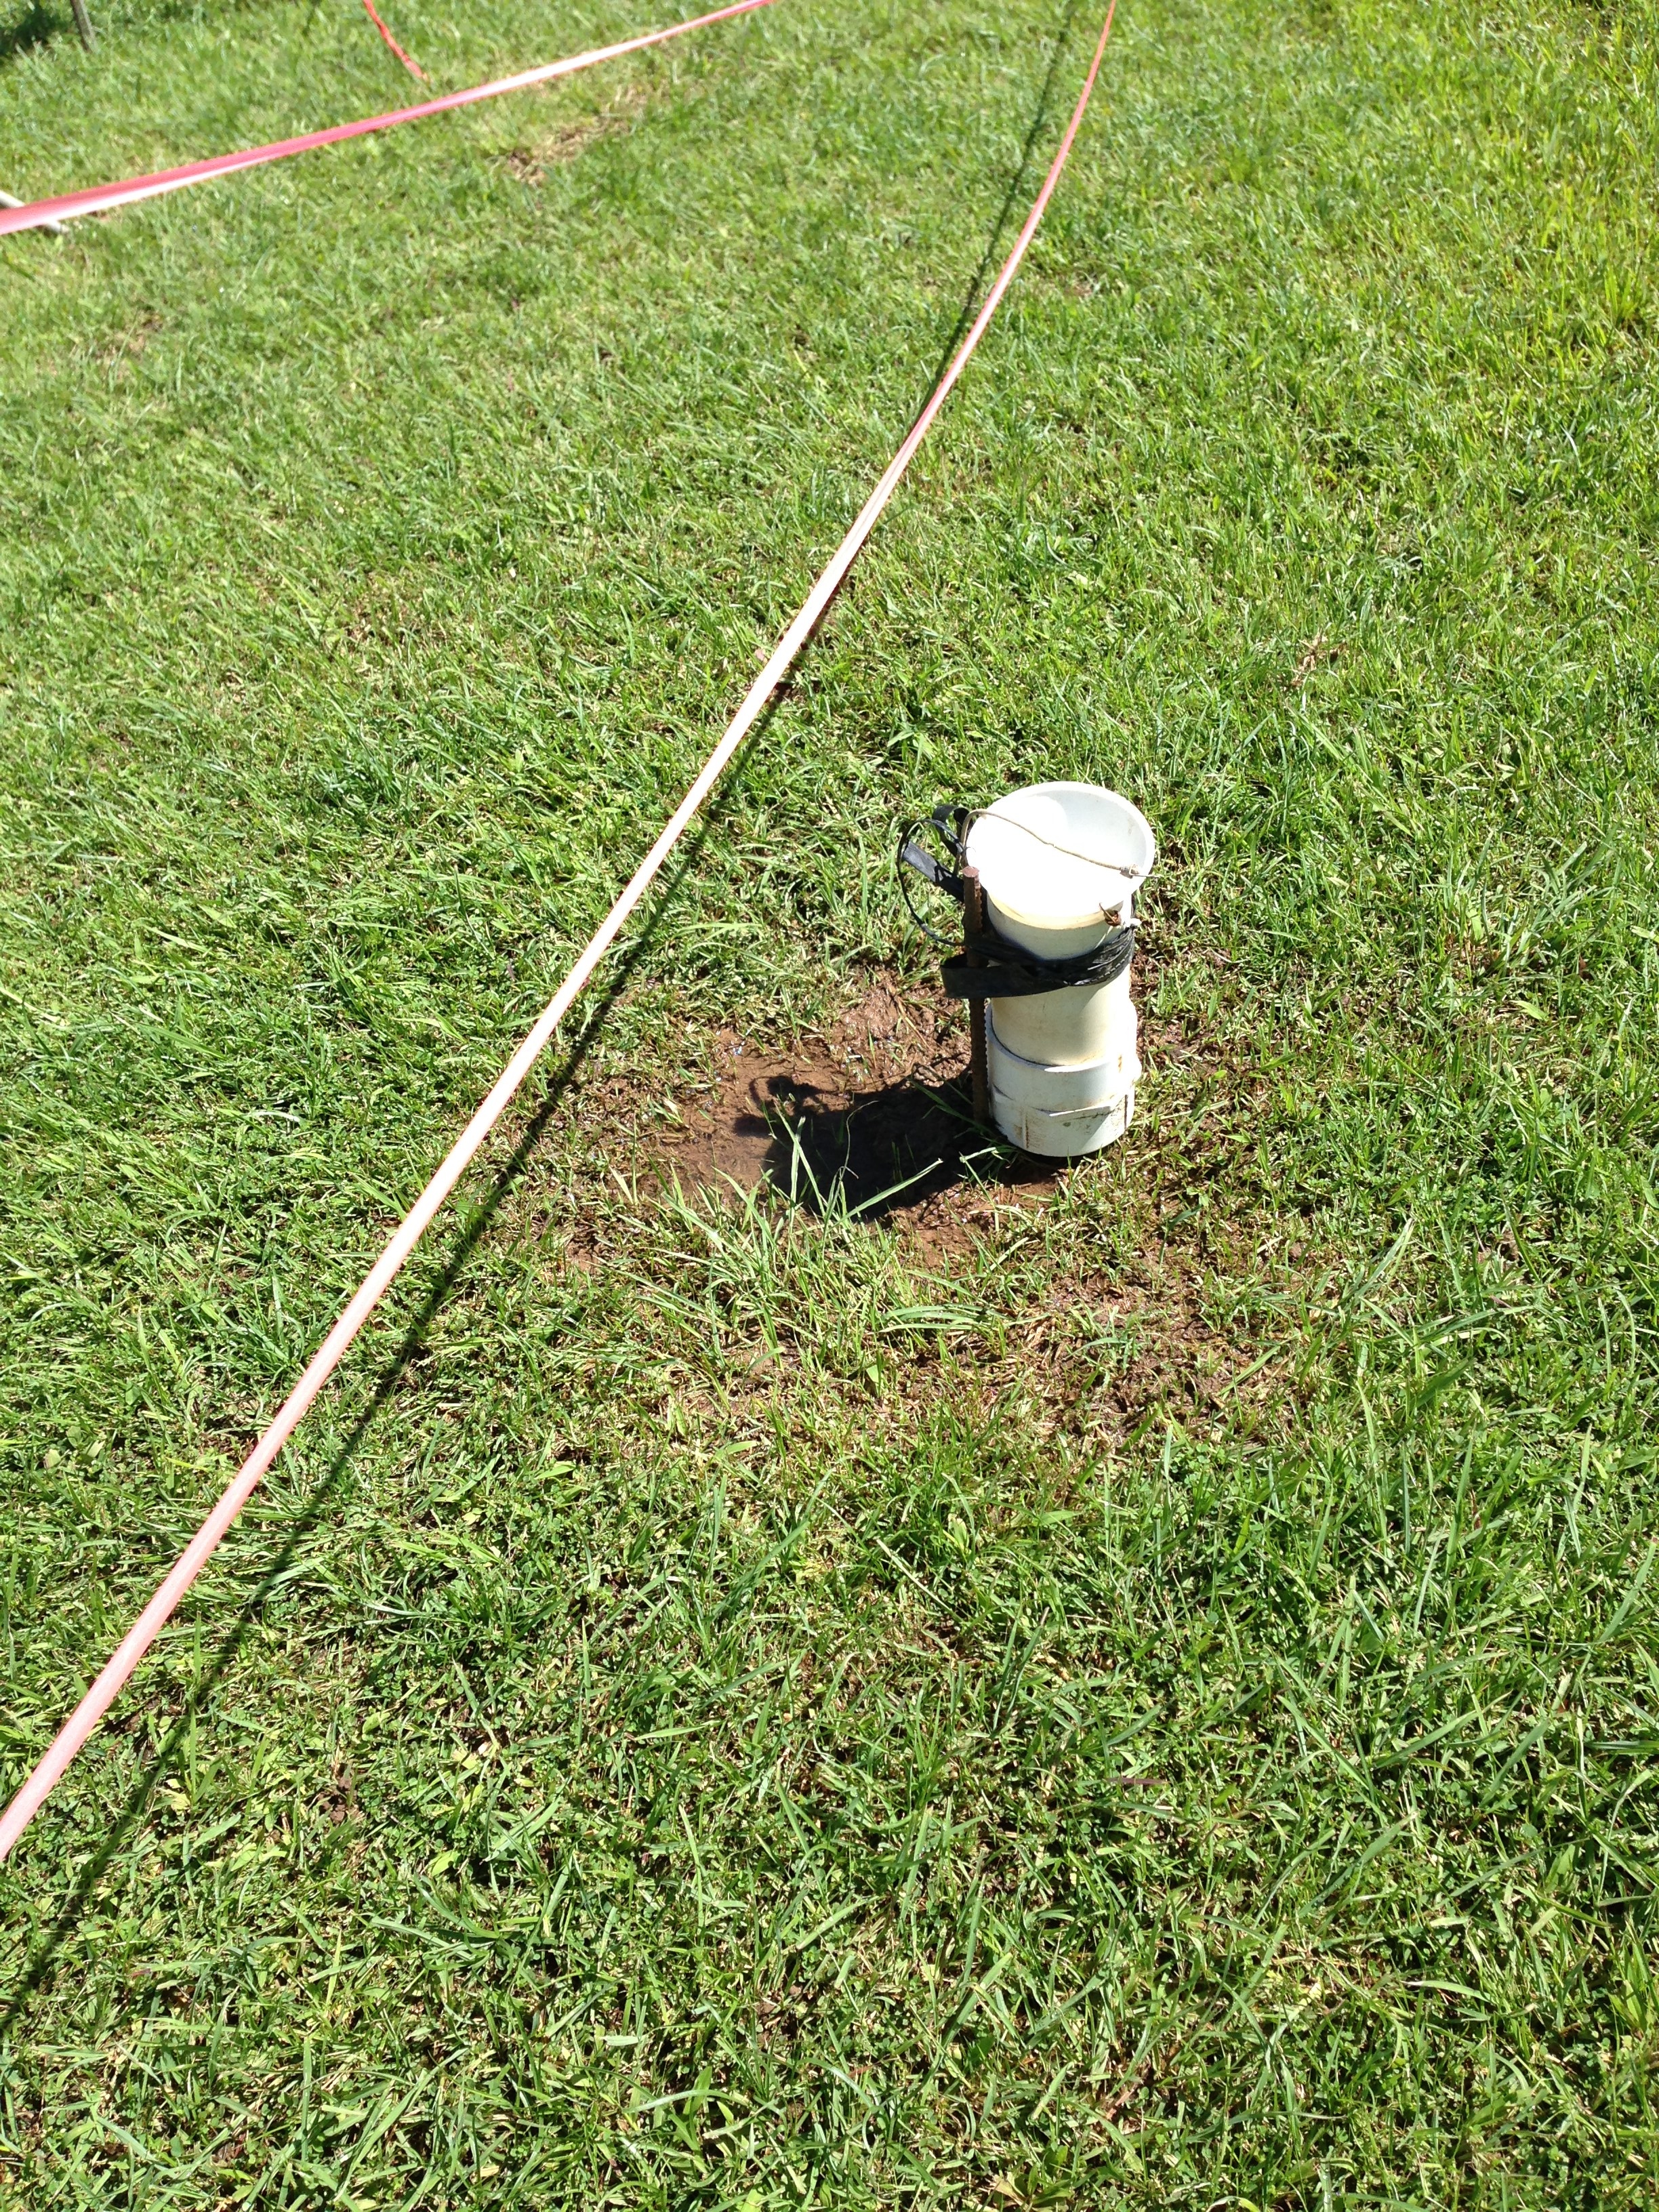
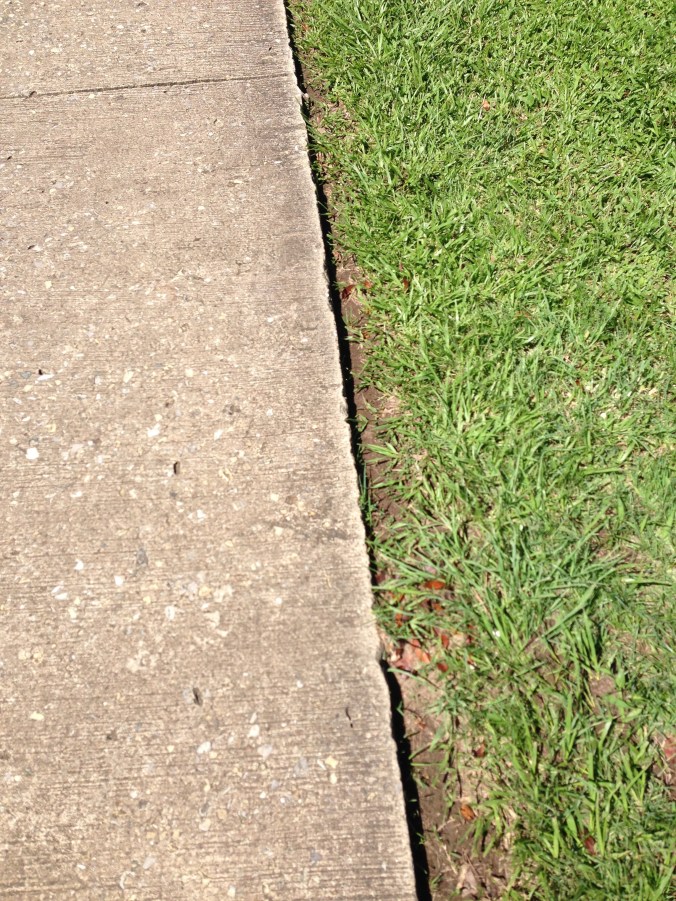
Here are some random pictures showing excessive trimming on the UPRM campus.

IMG_5693


IMG_5692

IMG_5689

IMG_5688

IMG_5695

IMG_5691
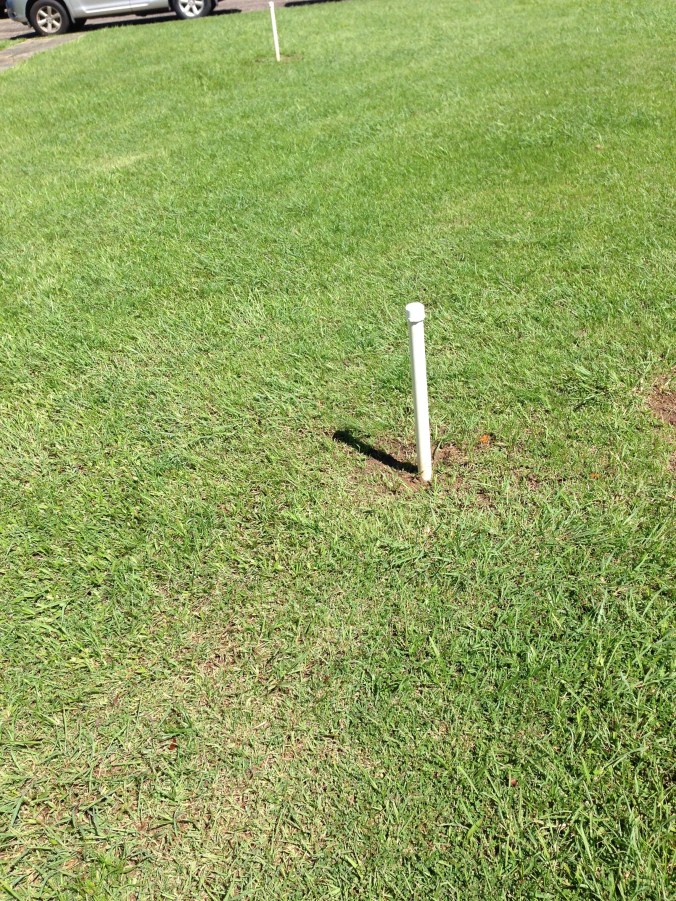
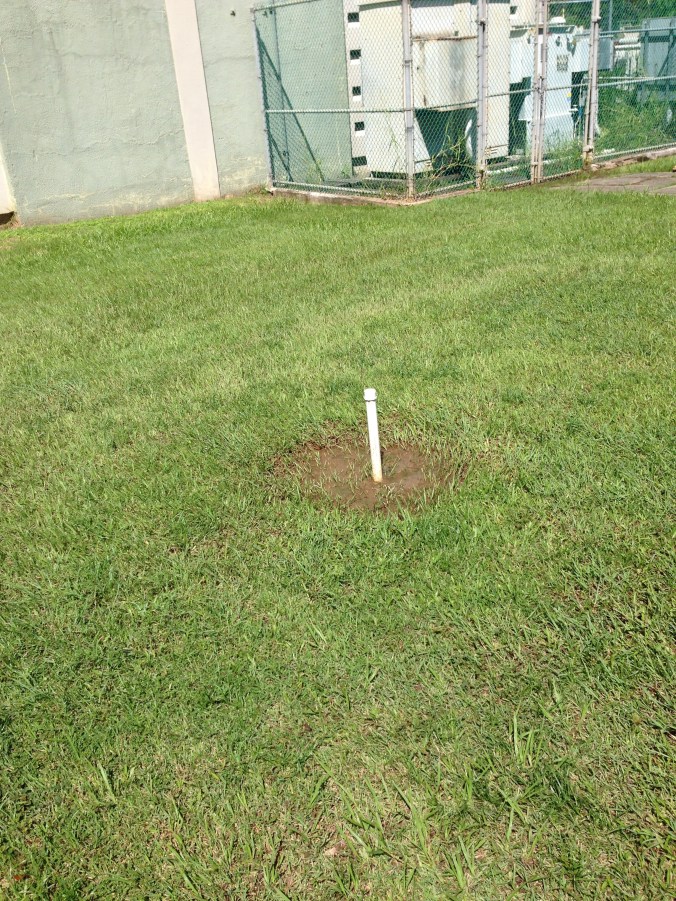
This is a groundwater observation well.  Notice that after it rains the depression fills with water.  This water will result in excessive infiltration around the well, possible altering the measured aquifer water level and the water quality.

IMG_5690
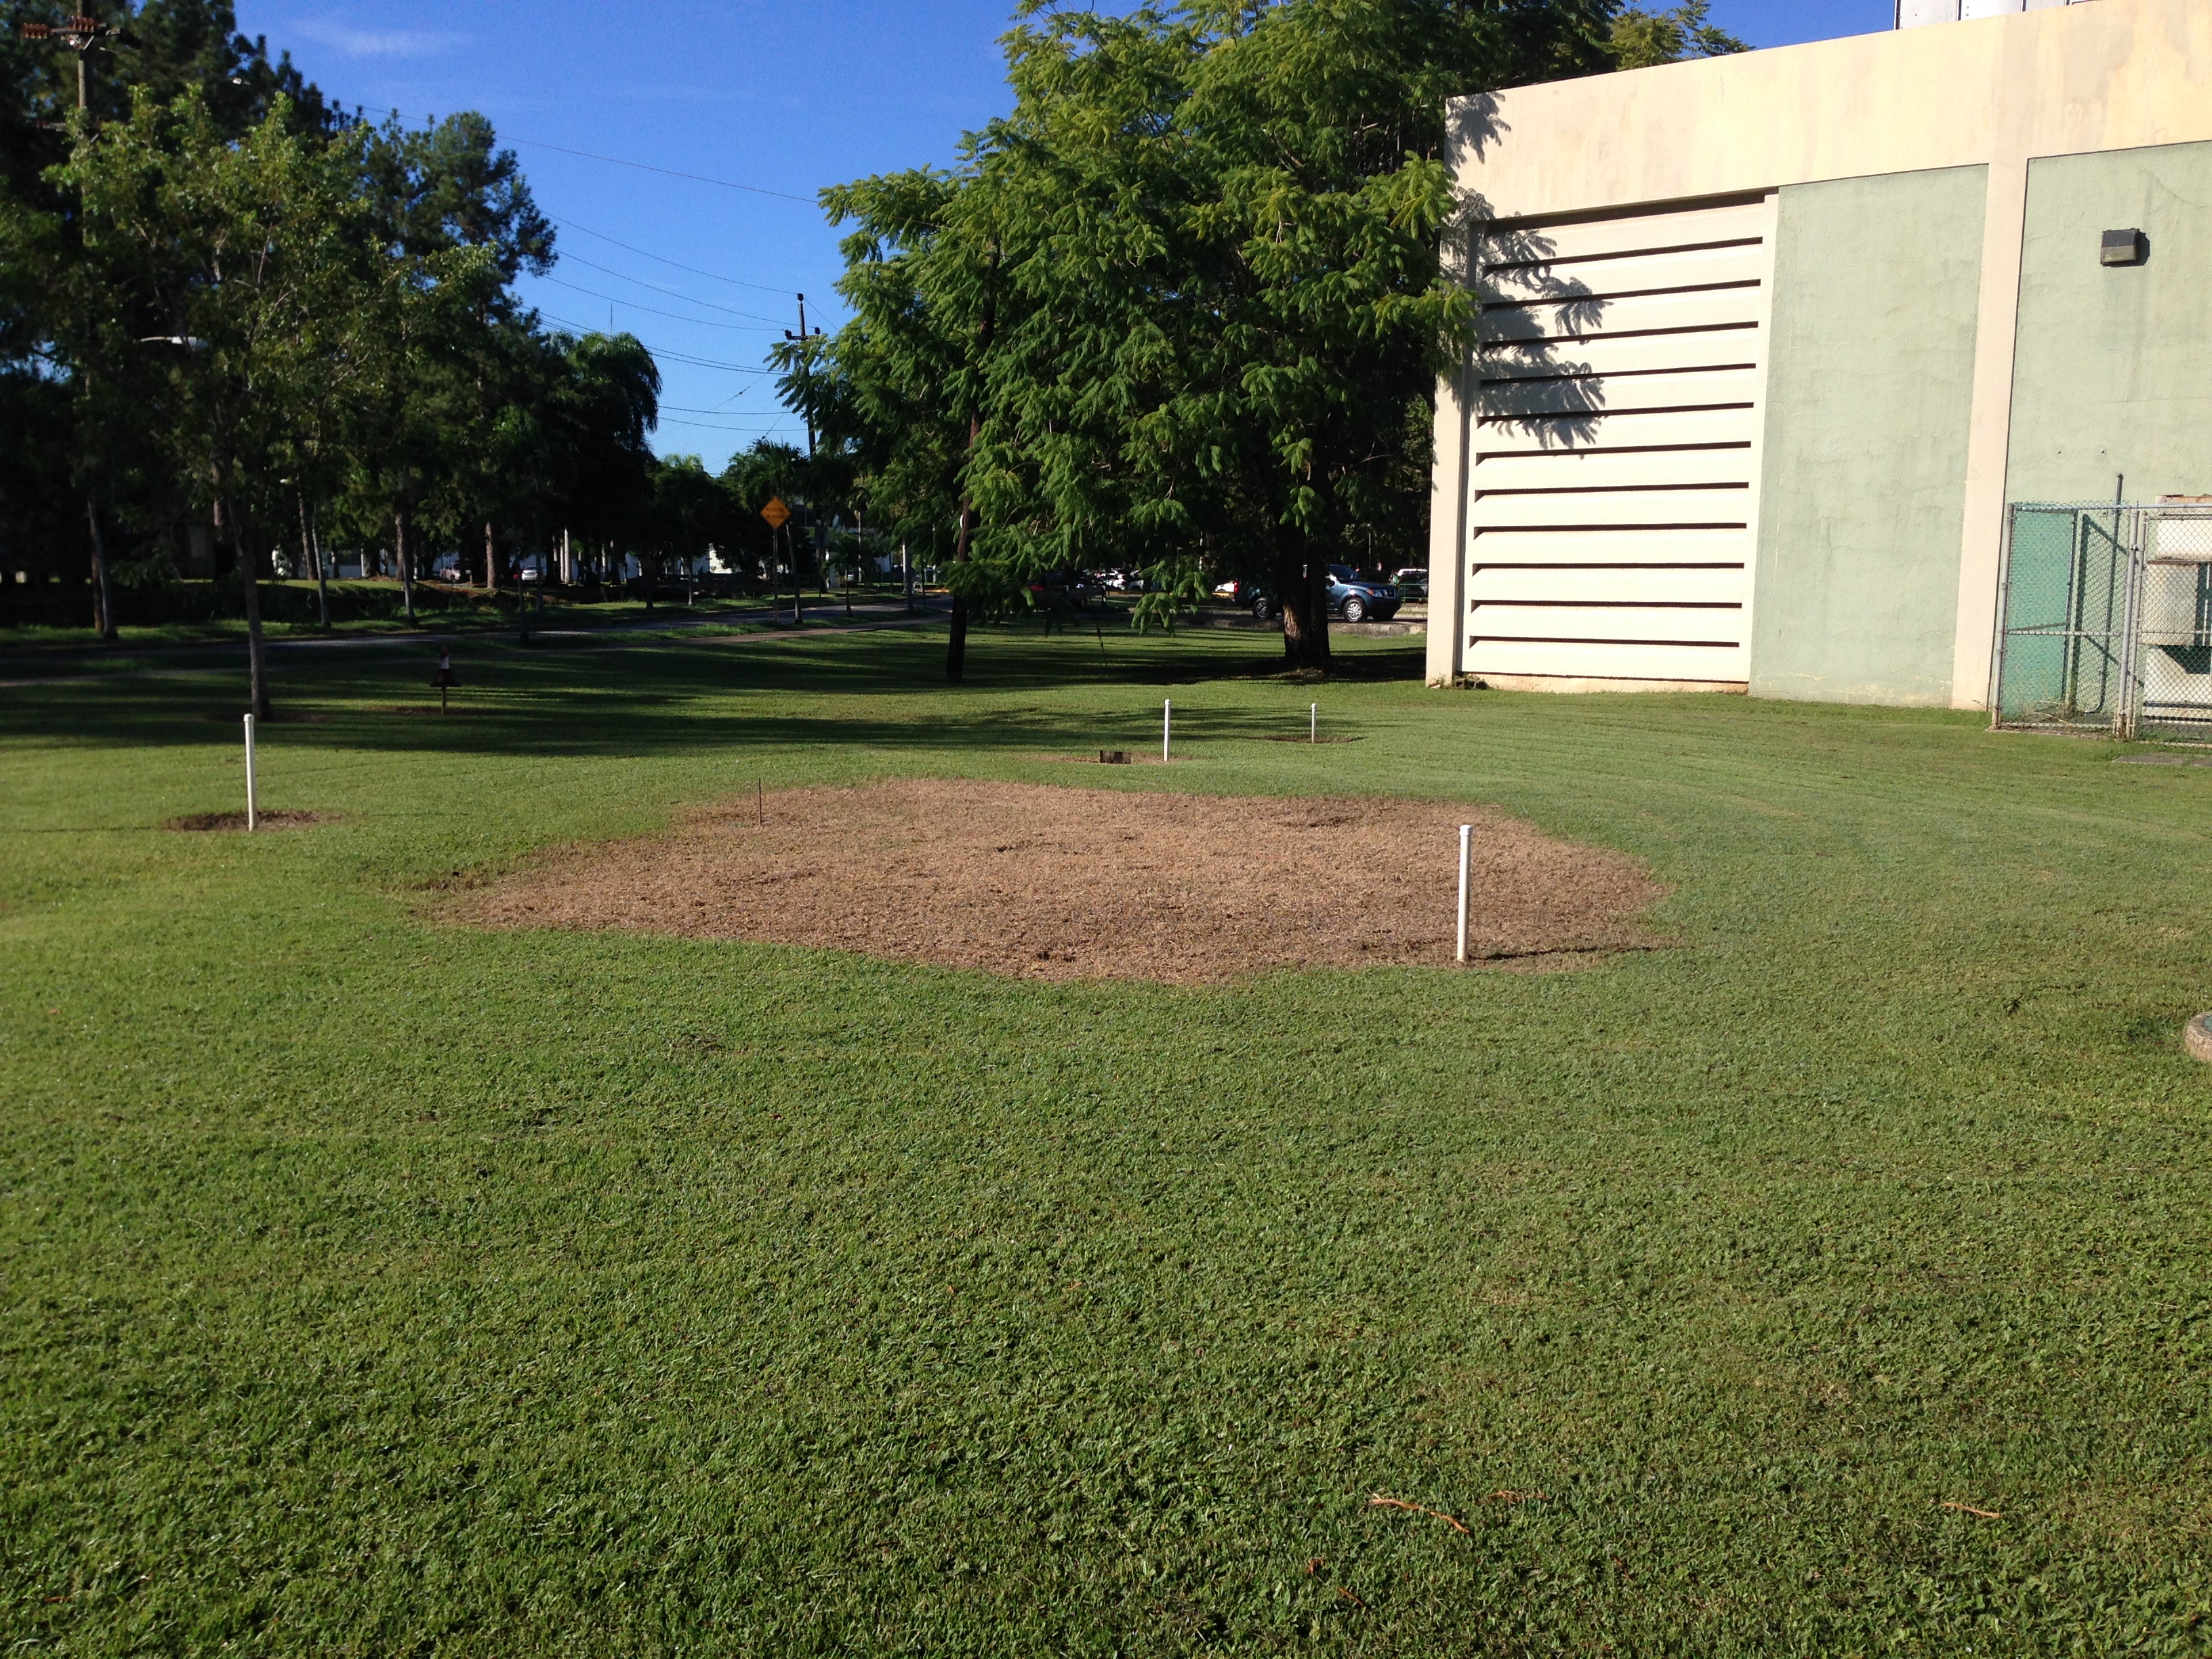
When I informed a couple of the worker about my concern, they agreed not to trim inside the perimeter of the area.  But to fulfill their mission, they came back with some type of chemical (Roundup?) and sprayed everything within the perimeter!!!!!!!!  OMG!!!!  Please stop trying to help me!  The two pictures below clearly show the grass dying within the area of the research equipment.  It is possible that within a week there will only be brown dirt within the area, I hope not.


IMG_5775

IMG_5774

UPDATE: Here is three days after the above pictures were taken.
IMG_5783
IMG_5784

On October 28, after the weather station equipment had been removed, here is what the grass looks like.

IMG_5849

Interviews with Real People Impacted by Climate Change

¿Cómo llega el arroz puertorriqueño a las bandejas de los comedor…

Untitled