5th National Climate Assessment – Caribbean Chapter
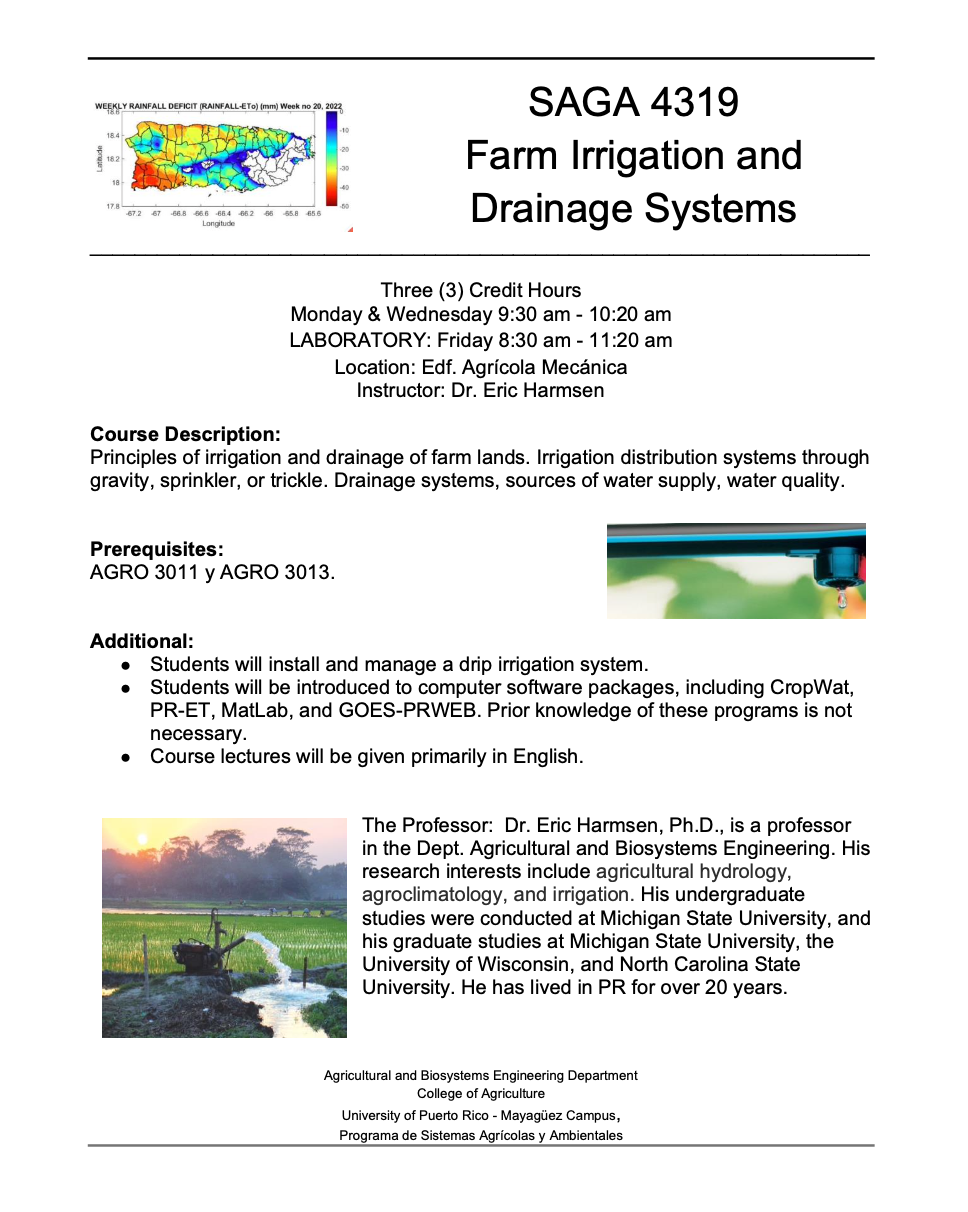
Course offering: SAGA 4319 Farm Irrigation and Drainage Systems
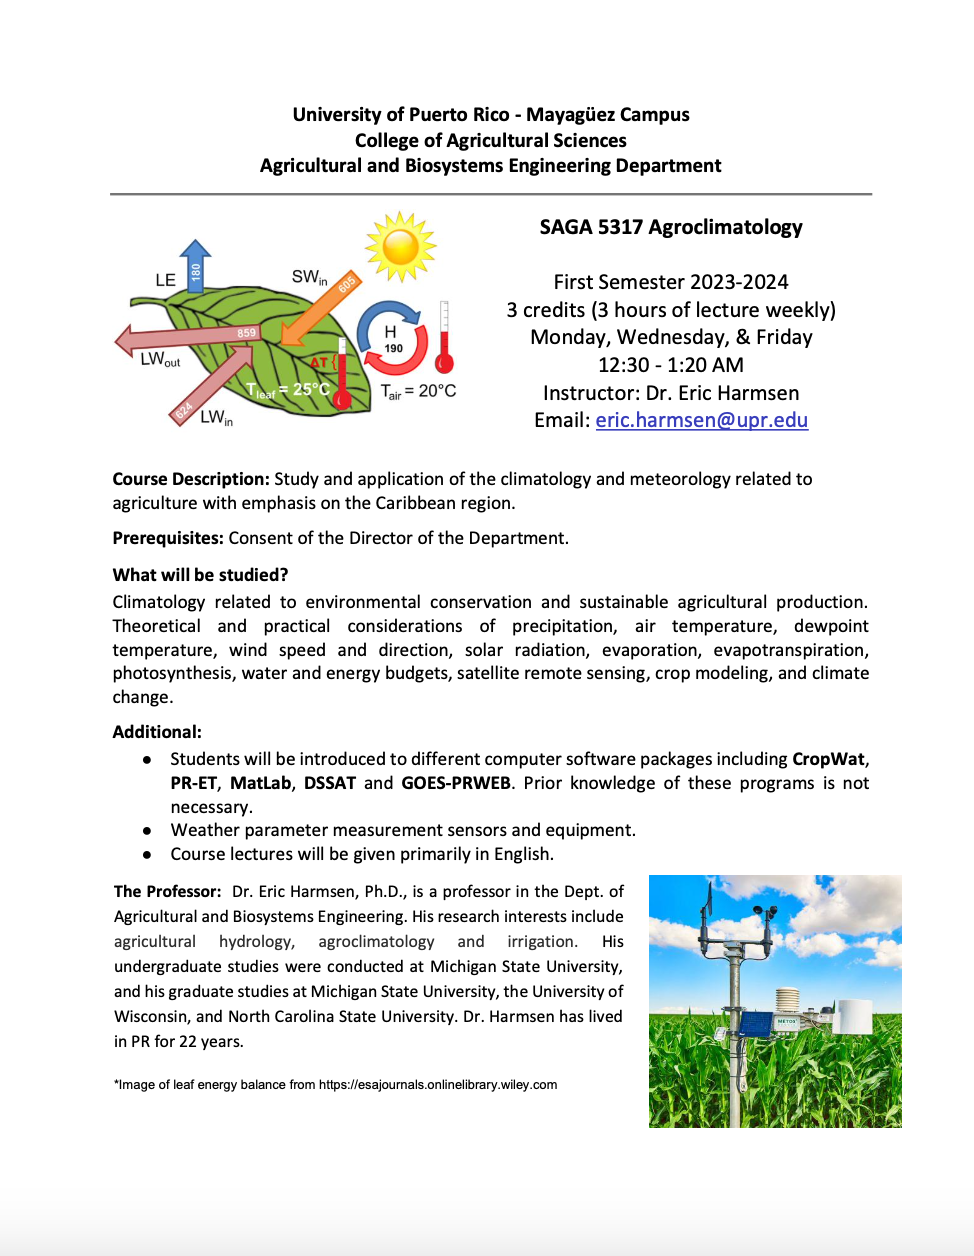
UPRM Course Announcement: Agroclimatology

UPRM Course Announcement: Agroclimatology
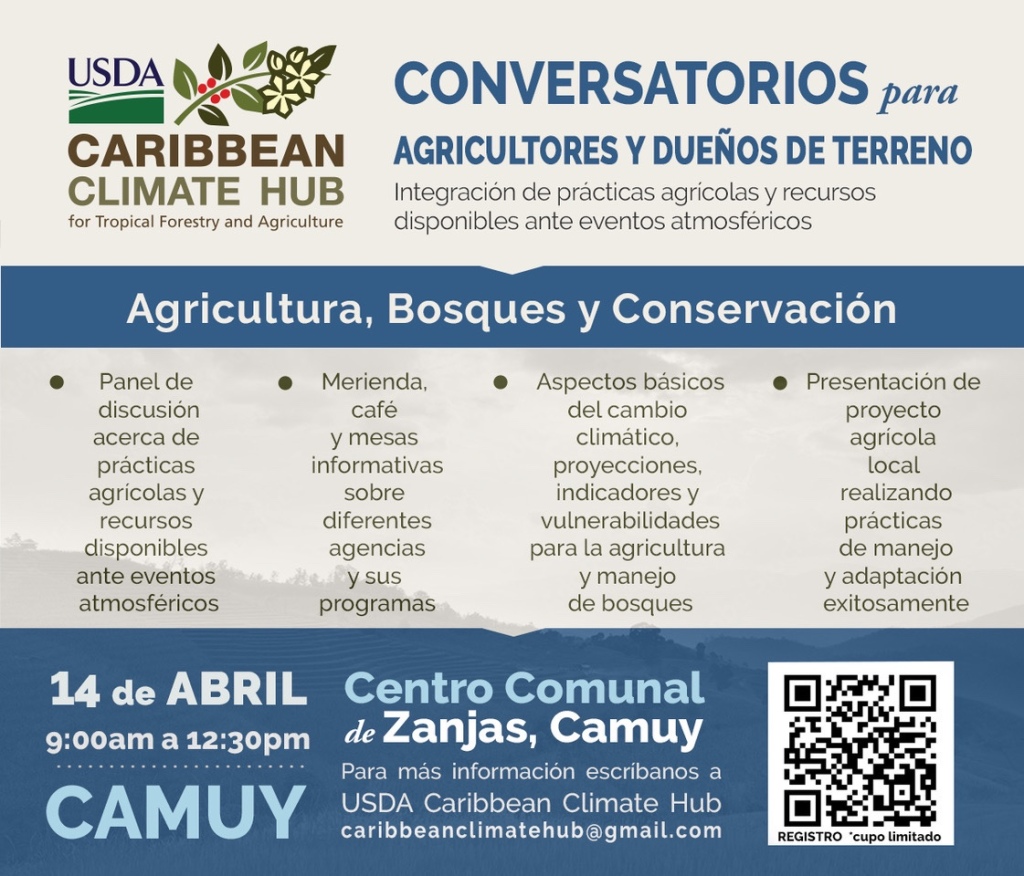
CONVERSATORIOS para AGRICULTORES Y DUEÑOS DE TERRENO – CAMUY

New Chiropractic Service Available on Campus
UPRM Course Announcement for next semester: SAGA 5315 Drip Irrigation Systems
Graduate students!! This course is also available at the 6000 level through the Departamento de Ciencias Agroambientales

How much was Puerto Rico’s drought reduced by Saturday’s (June 2, 2022) tropical wave?
In this blog, I will present various maps that can help us assess how much Saturday’s tropical wave helped to counter the drought in Puerto Rico (PR). Rainfall estimates shown in the article were obtained from the National Weather Service’s Advanced Hydrologic Prediction Service (AHPS). AHPS rainfall is derived from bias-corrected NEXRAD radar rainfall. Estimates of soil moisture saturation, crop stress factor, and surface runoff were estimated using the model GOES-PRWEB.
To gain a perspective, let us compare the June monthly rainfall for 2022 and 2021, shown in figures 1 and 2, respectively. Figure 1 shows how dry the conditions were in PR during the last month (2022). Maximum rainfall amounts during 2021 (Figure 3) were around 600 mm as compared to just over 350 mm in 2022. El Yunque Forest in northeast PR received only between 100 and 150 mm during June of 2022 compared with around 600 mm in 2021. Eastern PR only received around 50 to 100 mm (2 to 4 inches) during the month June 2022.


Figure 3 shows the rainfall received in PR on Saturday, July 2, 2022. The figure shows that a large quantity of rain was received in the southeast corner of PR. Most of the rainfall occurred in eastern PR, ranging from over 2 inches in Salinas and the Metro Area to over 7 inches in Yabucoa and Humacao. Western PR received relatively little rainfall.

Figure 4 and 5 compare the soil saturation from Friday, June 1 and Saturday, June 2, 2022, respectively. Soil saturation is defined as the fraction of water in the soil profile between the soil field capacity and permanent wilting point. A value of 1 indicates a soil moisture content equal to the soil field capacity, and a value of zero indicates a soil moisture content equal to the permanent wilting point. Figure 4 shows how dry the soils were throughout much of eastern PR and along the northern and southern coasts on Friday, July 1. Figure 5 shows the soil saturation after yesterday’s (June 2) tropical wave passed through Puerto Rico. Eastern PR benefited from the rainfall, especially along the eastern coast. Soils in western PR along the northern and southern coasts did not benefit significantly from the tropical wave, especially along the north coast.


Figure 6 and 7 compare the crop water stress factor for PR on Friday, July 1 and Saturday July 2, respectively. The crop stress factor assumes a typical agricultural crop will not experience water stress if the soil moisture content is greater than one-half of the Total Available Water (TAW). The TAW is defined as the difference between the moisture contents at field capacity and the permanent wilting point. Dark blue indicates no water stress and the dark red indicates extreme water stress. Comparison of the two figures (Figures 6 and 7) shows a significant reduction in crop stress throughout eastern PR on June 2 as compared to June 1.


Finally, Figure 8 shows the estimated surface runoff that resulted from Saturday’s tropical Wave. Runoff values range from around 25 mm (1 inch) in the Municipalities of Bayamon, San Juan, Caguas, and San Lorenzo. Runoff rates were higher in Yabucoa, Humacao and Nagüabo municipalities, with values ranging from 75 to 150 mm ( 3 to 6 inches). The runoff in eastern PR will provide much-needed water to the water supply reservoirs in that part of the island. According to Doriel Pagán, Executive Director of the AAA, “The amount of rain recorded in the past few hours has been beneficial, particularly in the Carraízo basin and the plants that are supplied from rivers in the Eastern and Metro Regions, to counteract, in part, the period of drought that we have been experiencing. ” (La AAA pausa todos sus planes de racionamiento tras El Paso de una onda tropical, El Nuevo Día, June 3, 2022).


